Clustering in R with a custom distance function
There are a lot of tutorials online which talk about how to cluster data, starting with a vector or list of inputs. The overall method used by most people is to create a distance matrix which represents the distance between any two pieces of data in the input. The resulting matrix is used as an input into a clustering algorithm (the maths for which is handled by an external library). This tutorial goes over the whole process, including the theory behind it, and plotting dendrograms afterwards. This documentation goes into clustering of DNA sequence objects.
Instead of using something like the following to generate the distance matrix, what if you need to do your own?
distMatr <- dist(inputDF, method = 'euclidean')
Creating a custom cost function
The library usedist is perfect for generating a distance matrix using a custom distance function.
Defining a function for the distance between two rows of a matrix allows the use of as many or as few features as needed (the columns of the matrix).
the dist_make() function then uses this function across the whole matrix to create the distance matrix.
library(usedist)

# Generate a matrix with two columns and 5 named rows
x <- matrix(sin(1:5), nrow=5)
rownames(x) <- LETTERS[1:5]

# Define a distance function.
# In this case, the mean absolute difference between the vars in columns of the input matrix.
distFun <- function(v1, v2) {
  mean(abs(v1 - v2))
}

# Create a distance matrix using the custom function
distMatrix <- dist_make(x, distFun)
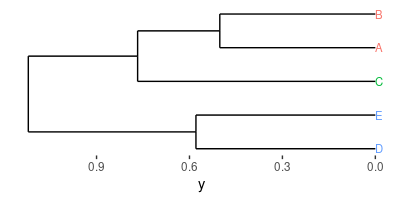
Bonus: cluster and plot the results in a horizontal tree
flashClust is a library which replaces the hclust of the default stats library with a much faster version.
ggdendro allows for the easy manipulation and plotting of the trees.
library(flashClust)
library('ggplot2')
library('ggdendro')

# Cluster the distance matrix
hClustOut <- hclust(as.dist(distMatrix), method = 'average')

# Create a tree from the cluster
dendr <- dendro_data(hClustOut, type="rectangle")

# Cut the tree into clusters, based on a flat cut-off of branch length
clust    <- cutree(hClustOut,h=0.6)

# Create a dataframe which can be used by ggplot to extract factors
clustDF <- data.frame(label=names(clust), cluster=factor(clust))

# Allow the tree to have information like factors (for colouring of the clusters)
dendr[["labels"]] <- merge(dendr[["labels"]],clustDF, by="label")

# Plot the tree sideways
ggplot() +
  geom_segment(data=segment(dendr),
               aes(x=x, y=y, xend=xend, yend=yend)) +
  geom_text(data=label(dendr),
            aes(x, y, label=label, hjust=0, color=cluster),
            size=3) +
  coord_flip() +
  scale_y_reverse() +
  theme(axis.line.y=element_blank(),
        axis.ticks.y=element_blank(),
        axis.text.y=element_blank(),
        axis.title.y=element_blank(),
        panel.background=element_rect(fill="white"),
        panel.grid=element_blank(),
        legend.position = "none")
The output