Plotting time series in R
Intro
Let’s say you have a time series of data which looks something like this:
DateTime	Value
2023-01-01 01:00:58	11
2023-01-01 01:28:38	26
2023-01-01 02:11:32	9
2023-01-01 04:12:01	32
or
Time	Value
17:25:08	19
17:35:21	43
19:06:08	70
19:16:28	59
You may want to plot them as time series.
Plotting a POSIX compliant timestamp series
An example file for this is available here. Download it and read it in as a dataframe.
df <- read.table("/path/to/2024-04-12-DateSeriesData.tsv", header = TRUE, sep = "\t")
Plotting these timestamps can be done using ggplot2, as long as you tell the ggplot() function that the values with one axis are timestamps.
The as.POSIXct() base function can be used to do so.
ggplot(df, aes(x = as.POSIXct(DateTime), y = Value)) +
  xlim(min(as.POSIXct(df$DateTime)), max(as.POSIXct(df$DateTime))) +
  geom_line() +
  xlab("Time") +
  theme_classic()
This gives the following:

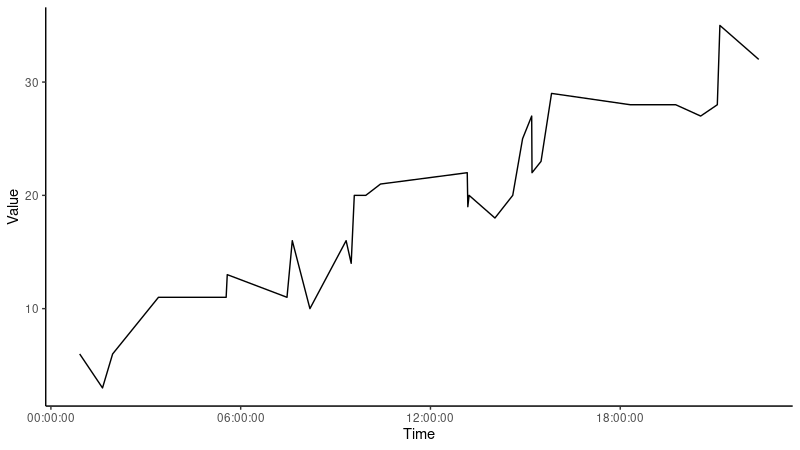
Plotting other time series types
An example file for this is available here. Download it and read it in as a dataframe.
ggplot(df, aes(x = as.POSIXct(Time, format = "%H:%M:%OS"), y = Value)) +
  xlim(min(as.POSIXct(df$Time, format = "%H:%M:%OS")), max(as.POSIXct(df$Time, format = "%H:%M:%OS"))) +
  scale_x_datetime(labels = function(x) format(x, format = "%H:%M:%OS")) +
  geom_line() +
  xlab("Time") +
  theme_classic()
In this case, the format is %H:%M:%OS, and you will need to tell as.POSIXct() what the format is.
I think as.POSIXct() likes to add the current date to any timestamps that have no date attached to them.
To remove this on our graph, we can use scale_x_datetime() to redraw the x-axis with our own format.
This gives the warning:
Scale for x is already present.
Adding another scale for x, which will replace the existing scale.
but we don’t care about that.
This produces the following graph: